Perfetto traces
Nextest supports exporting traces in the Chrome Trace Event format. Chrome traces can be imported into Perfetto for visualization and analysis. Traces can also be loaded in Chrome's built-in viewer at chrome://tracing, though Perfetto is recommended for its richer UI and SQL query support.
Traces cover the test execution phase only; the build phase is not included.
Use cases
Perfetto traces can be used to observe the timeline of a test run, and to find bottlenecks or long-pole tests that might be affecting test execution speed. For example, Perfetto traces can be used to identify slow tests holding up test runs, in order to prioritize them first.
Perfetto also has a built-in query language called PerfettoSQL. For example queries, see Example queries below.
Prerequisites
To enable run recording, see Setting up run recording.
Exporting traces
To export the latest recording as a Chrome trace:
cargo nextest store export-chrome-trace latest
By default, this prints the trace to standard output. To instead write the trace to a file, use the -o/--output option:
cargo nextest store export-chrome-trace latest -o trace.json
Traces can also be exported from a portable recording, e.g., a recording generated in CI:
cargo nextest store export-chrome-trace my-run.zip
By default, data is produced in a compact JSON format. For prettified JSON, use --message-format json-pretty:
cargo nextest store export-chrome-trace latest --message-format json-pretty
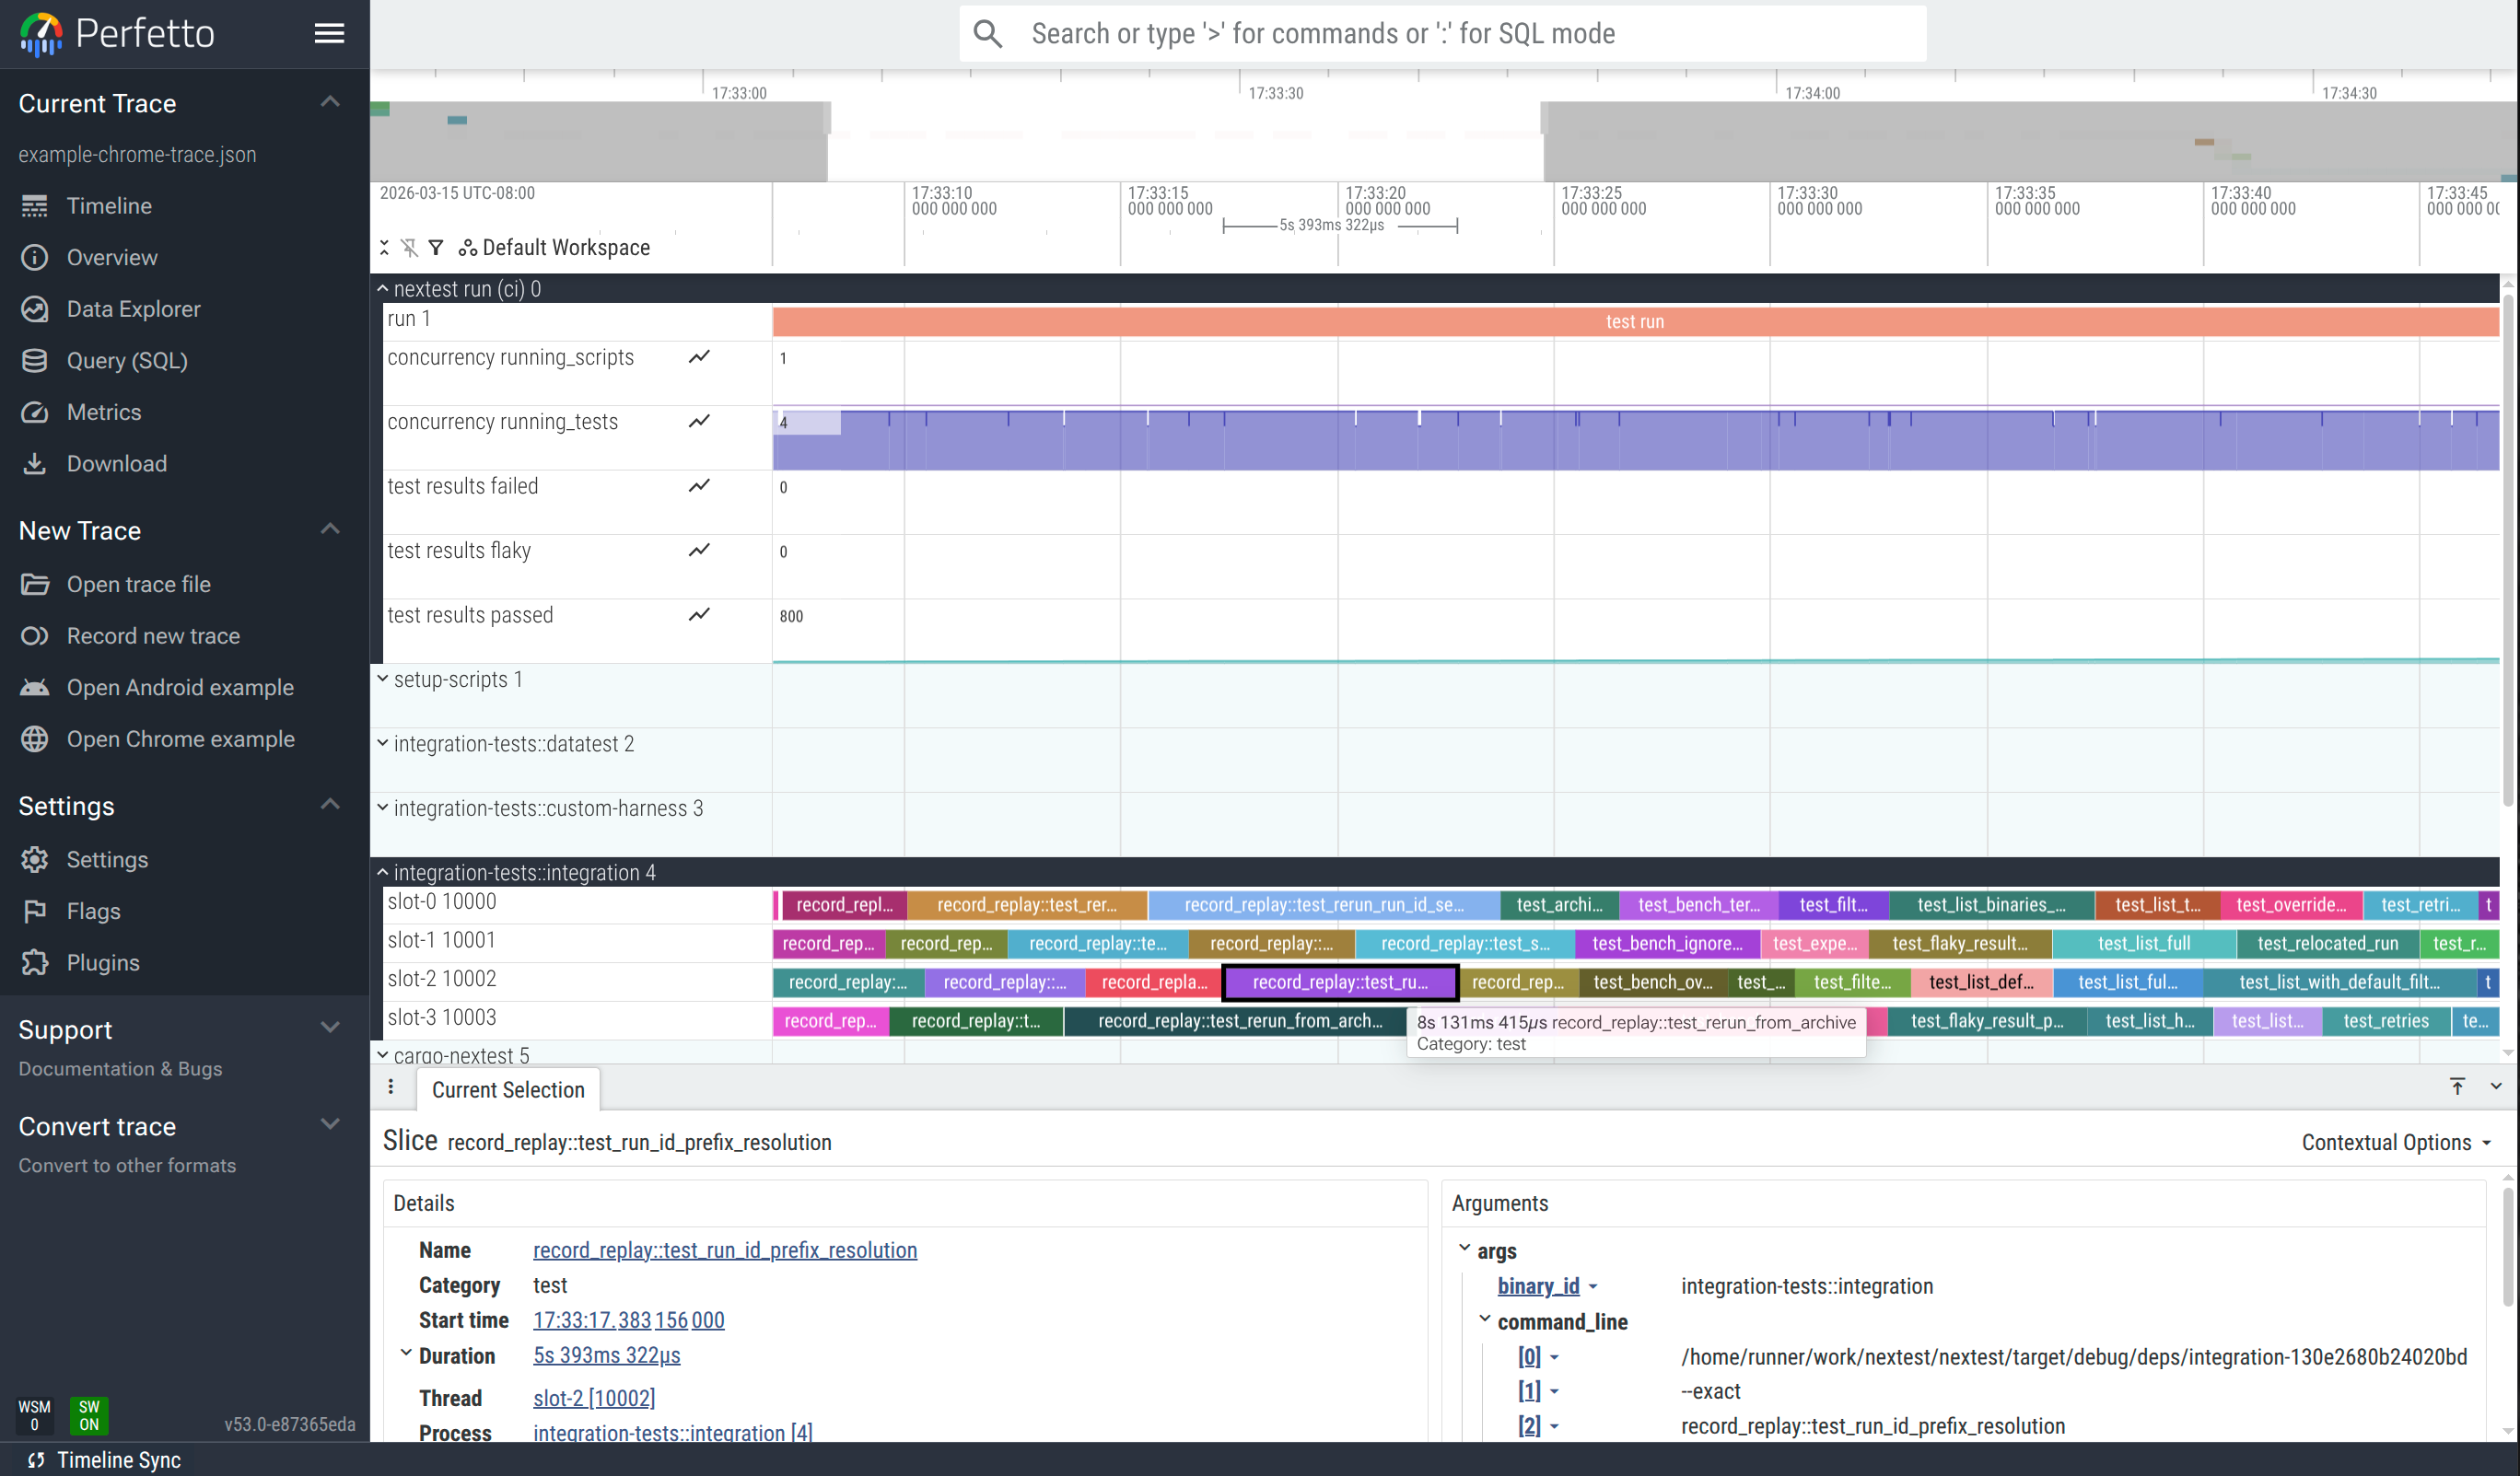
An example of a trace loaded into the Perfetto web UI: ui.perfetto.dev.
Trace dimension mapping
Each test binary is considered a "process", and each global slot number (see Slot numbers) is considered a "thread". Tests are shown as blocks within each slot.
pidis a synthetic, numerically increasing ID unique to a binary ID.tidis the global slot number (starting from 0) plus 10 000.nameis the name of the test.catis typically"test"or"run". For setup scripts it is"setup-script". For stress sub-runs it is"stress".tsis the actual timestamp of each event.argscontains metadata for each test, such as whether it passed or failed.
Example events for a test
The following is a pair of B (begin) and E (end) events for a single test, extracted from the example trace. Together, these two events define the duration of the test test_archive_with_build_filter in the integration-tests::integration binary.
The begin event ("ph": "B") is emitted when the test starts. The args contain the binary ID, test name, and the command line used to run the test.
{
  "name": "test_archive_with_build_filter",
  "cat": "test",
  "ph": "B",
  "ts": 1773896819127008.0,
  "pid": 3,
  "tid": 10000,
  "args": {
    "binary_id": "integration-tests::integration",
    "test_name": "test_archive_with_build_filter",
    "command_line": [
      "/path/to/target/debug/deps/integration-06fc3653fb286b3a",
      "--exact",
      "test_archive_with_build_filter",
      "--nocapture"
    ]
  }
}
The end event ("ph": "E") is emitted when the test finishes. The args are enriched with result information: status, duration, attempt count, and whether the test was slow.
{
  "name": "test_archive_with_build_filter",
  "cat": "test",
  "ph": "E",
  "ts": 1773896837615619.0,
  "pid": 3,
  "tid": 10000,
  "args": {
    "binary_id": "integration-tests::integration",
    "test_name": "test_archive_with_build_filter",
    "time_taken_ms": 18488.306286,
    "result": {
      "status": "pass"
    },
    "attempt": 1,
    "total_attempts": 1,
    "is_slow": false,
    "test_group": "my-group"
  }
}
Note that pid 3 corresponds to the integration-tests::integration binary (set via a process_name metadata event), and tid 10000 corresponds to slot 0 (10000 = slot number + TID offset of 10000).
There is also a global "nextest run" process with a bar for the overall run, as well as several time-series (counter) plots:
concurrency running_scriptsshows the number of setup scripts running at a given time.concurrency running_testsshows the number of tests running at a given time.test results passed,test results failed, andtest results flakycontain the number of tests passed, failed, and flaky respectively.
Grouping by slot
By default, each test binary is treated as a separate process. To combine all test binaries into a single process grouped by concurrency slot, use --group-by slot:
cargo nextest store export-chrome-trace latest --group-by slot
This is useful when you care about how well concurrency slots are packed rather than which binary a test belongs to; for example, to see if slots are sitting idle between tests.
PerfettoSQL queries
Perfetto has a powerful query language, PerfettoSQL, that can be used to analyze test runs. Queries can be run in the "Query (SQL)" view, or via the omnibox at the top of the page.
Try running the example queries below against the interactive example.
Example queries
Note
These queries use args.binary_id and args.test_name embedded in the metadata, as opposed to using the Perfetto thread name (name) and process name (process_name) fields. This means they work with both the default --group-by binary and with --group-by slot.
These queries also use the embedded time_taken_ms, which is generally the same as the duration computed by Perfetto, but works properly in case a test run is paused with Ctrl-Z (SIGTSTP) and resumed later.
For maximum compatibility, it is recommended that your queries follow the same patterns.
Print a list of the top 20 slowest tests:
SELECT
  EXTRACT_ARG(arg_set_id, 'args.binary_id') AS binary_id,
  EXTRACT_ARG(arg_set_id, 'args.test_name') AS test_name,
  EXTRACT_ARG(arg_set_id, 'args.time_taken_ms') AS time_taken_ms
FROM slice
WHERE category = 'test'
ORDER BY time_taken_ms DESC
LIMIT 20;
Total test time per binary:
SELECT
  EXTRACT_ARG(arg_set_id, 'args.binary_id') AS binary_id,
  COUNT(*) AS test_count,
  SUM(EXTRACT_ARG(arg_set_id, 'args.time_taken_ms')) AS total_ms,
  AVG(EXTRACT_ARG(arg_set_id, 'args.time_taken_ms')) AS avg_ms,
  MAX(EXTRACT_ARG(arg_set_id, 'args.time_taken_ms')) AS max_ms,
  MIN(EXTRACT_ARG(arg_set_id, 'args.time_taken_ms')) AS min_ms
FROM slice
WHERE category = 'test'
GROUP BY binary_id
ORDER BY total_ms DESC;
Duration distribution histogram:
SELECT
  CASE
    WHEN time_taken_ms < 100 THEN '< 100ms'
    WHEN time_taken_ms < 1000 THEN '100ms - 1s'
    WHEN time_taken_ms < 5000 THEN '1s - 5s'
    WHEN time_taken_ms < 10000 THEN '5s - 10s'
    WHEN time_taken_ms < 30000 THEN '10s - 30s'
    ELSE '> 30s'
  END AS bucket,
  COUNT(*) AS count
FROM (
  SELECT EXTRACT_ARG(arg_set_id, 'args.time_taken_ms') AS time_taken_ms
  FROM slice
  WHERE category = 'test'
)
GROUP BY bucket
ORDER BY MIN(time_taken_ms);
Setup script statuses and durations:
SELECT
  EXTRACT_ARG(arg_set_id, 'args.script_id') AS script_id,
  EXTRACT_ARG(arg_set_id, 'args.time_taken_ms') AS time_taken_ms,
  EXTRACT_ARG(arg_set_id, 'args.result.status') AS status
FROM slice
WHERE category = 'setup-script'
ORDER BY time_taken_ms DESC;
Tests in a non-default test group:
SELECT
  EXTRACT_ARG(arg_set_id, 'args.binary_id') AS binary_id,
  EXTRACT_ARG(arg_set_id, 'args.test_name') AS test_name,
  EXTRACT_ARG(arg_set_id, 'args.test_group') AS test_group,
  EXTRACT_ARG(arg_set_id, 'args.time_taken_ms') AS time_taken_ms
FROM slice
WHERE category = 'test'
  AND EXTRACT_ARG(arg_set_id, 'args.test_group') != '@global'
ORDER BY time_taken_ms DESC;
Retried tests:
SELECT
  EXTRACT_ARG(arg_set_id, 'args.binary_id') AS binary_id,
  EXTRACT_ARG(arg_set_id, 'args.test_name') AS test_name,
  EXTRACT_ARG(arg_set_id, 'args.attempt') AS attempt,
  EXTRACT_ARG(arg_set_id, 'args.total_attempts') AS total_attempts,
  EXTRACT_ARG(arg_set_id, 'args.result.status') AS status,
  EXTRACT_ARG(arg_set_id, 'args.time_taken_ms') AS time_taken_ms
FROM slice
WHERE category = 'test'
  AND EXTRACT_ARG(arg_set_id, 'args.total_attempts') > 1
ORDER BY binary_id, test_name, attempt;
Slot utilization (how busy each concurrency slot was):
SELECT
  t.name AS slot,
  COUNT(*) AS tests_run,
  SUM(EXTRACT_ARG(s.arg_set_id, 'args.time_taken_ms')) AS busy_ms
FROM slice s
JOIN thread_track tt ON s.track_id = tt.id
JOIN thread t USING (utid)
WHERE s.category = 'test'
GROUP BY t.name
ORDER BY busy_ms DESC;
Discovering available metadata
Nextest embeds test metadata (binary ID, result status, attempt count, test group, etc.) as args on each trace event. To see all available keys for test events, run:
SELECT DISTINCT flat_key
FROM args
WHERE arg_set_id IN (
  SELECT arg_set_id FROM slice WHERE category = 'test' LIMIT 1
);
These keys can then be accessed with EXTRACT_ARG(arg_set_id, '<key>') in queries.
Learn more
Options and arguments
cargo nextest store export-chrome-trace
The output of cargo nextest store export-chrome-trace -h:
Export a recorded run as a Chrome Trace Event Format JSON file

Usage: cargo nextest store export-chrome-trace [OPTIONS] [RUN_ID_OR_RECORDING]

Arguments:
  [RUN_ID_OR_RECORDING]  Run ID, latest, or recording path [aliases: -R]

Options:
      --color <WHEN>             Produce color output: auto, always, never [env:
                                 CARGO_TERM_COLOR=always] [default: auto]
      --group-by <MODE>          How to group tests in the trace output [default: binary] [possible
                                 values: binary, slot]
      --no-pager                 Do not pipe output through a pager
  -v, --verbose                  Verbose output [env: NEXTEST_VERBOSE=]
      --message-format <FORMAT>  JSON serialization format for the output [default: json] [possible
                                 values: json, json-pretty]
  -o, --output <PATH>            Output file path. Defaults to stdout
  -h, --help                     Print help (see more with '--help')

Manifest options:
      --manifest-path <PATH>  Path to Cargo.toml

Config options:
      --config-file <PATH>
          Config file [default: workspace-root/.config/nextest.toml]
      --user-config-file <PATH>
          User config file [default: ~/.config/nextest/config.toml or platform equivalent] [env:
          NEXTEST_USER_CONFIG_FILE=]
      --tool-config-file <TOOL:ABS_PATH>
          Tool-specific config files
      --override-version-check
          Override checks for the minimum version defined in nextest's config
  -P, --profile <PROFILE>
          The nextest profile to use [env: NEXTEST_PROFILE=]
The output of cargo nextest store export-chrome-trace --help:
Export a recorded run as a Chrome Trace Event Format JSON file.

The output can be loaded into Chrome's chrome://tracing or Perfetto UI (ui.perfetto.dev) for a
timeline view of test parallelism and execution.

Usage: cargo nextest store export-chrome-trace [OPTIONS] [RUN_ID_OR_RECORDING]

Arguments:
  [RUN_ID_OR_RECORDING]
          Run ID, latest, or recording path [aliases: -R].

          Accepts "latest" for the most recent completed run, a full UUID or unambiguous prefix, or
          a file path (ending in .zip, or, on Unix, <(curl url)).

Options:
      --color <WHEN>
          Produce color output: auto, always, never

          [env: CARGO_TERM_COLOR=always]
          [default: auto]

      --group-by <MODE>
          How to group tests in the trace output

          Possible values:
          - binary: Group tests by binary: each binary gets its own process in the trace viewer, and
            event names show only the test name
          - slot:   Group tests by slot: all tests share one process, so each row represents a slot.
            Event names include the binary name

          [default: binary]

      --no-pager
          Do not pipe output through a pager

  -v, --verbose
          Verbose output

          [env: NEXTEST_VERBOSE=]

      --message-format <FORMAT>
          JSON serialization format for the output

          Possible values:
          - json:        JSON with no whitespace
          - json-pretty: JSON, prettified

          [default: json]

  -o, --output <PATH>
          Output file path. Defaults to stdout

  -h, --help
          Print help (see a summary with '-h')

Manifest options:
      --manifest-path <PATH>
          Path to Cargo.toml

Config options:
      --config-file <PATH>
          Config file [default: workspace-root/.config/nextest.toml]

      --user-config-file <PATH>
          User config file [default: ~/.config/nextest/config.toml or platform equivalent].

          User configuration stores per-user preferences like UI settings. Use "none" to skip
          loading user config entirely.

          [env: NEXTEST_USER_CONFIG_FILE=]

      --tool-config-file <TOOL:ABS_PATH>
          Tool-specific config files.

          Some tools on top of nextest may want to set up their own default configuration but
          prioritize user configuration on top. Use this argument to insert configuration that's
          lower than --config-file in priority but above the default config shipped with nextest.

          Arguments are specified in the format "tool:abs_path", for example
          "my-tool:/path/to/nextest.toml" (or "my-tool:C:\path\to\nextest.toml" on Windows). Paths
          must be absolute.

          This argument may be specified multiple times. Files that come later are lower priority
          than those that come earlier.

      --override-version-check
          Override checks for the minimum version defined in nextest's config.

          Repository and tool-specific configuration files can specify minimum required and
          recommended versions of nextest. This option overrides those checks.

  -P, --profile <PROFILE>
          The nextest profile to use.

          Nextest's configuration supports multiple profiles, which can be used to set up different
          configurations for different purposes. (For example, a configuration for local runs and
          one for CI.) This option selects the profile to use.

          [env: NEXTEST_PROFILE=]